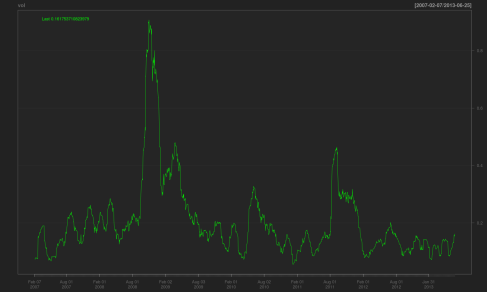
Let’s do an easy experiment. Lets caluclate the 25-day rolling volatility of the S&P 500 from 2007 onwards.
1-Get the data:
getSymbols(‘SPY’,from=’2007/01/01′)
2-Run the volatility function from the package TTR (comes along with quantmod):
vol=volatility(SPY,n=25,N=252,calc=’close’)
#n=25 means we want 25 day rolling volatility. N=252 means we are taking a year as 252 days. calc=’close’ indicates that we want to calculate Close to Close volatility. If you look at the help page for the volatility function, there are several different calc=” parameters available.
3-We can now plot this using chartSeries(vol). Notice the huge spike in volatility in 2008.

